02/10/2026
Survey Bias: The Six Types That Survive QA and Reach Your Deal Deck
What is survey bias? Six types that pass fraud QA, from sampling and nonresponse bias to leading questions, and the five questions to ask before the deck.
A survey that passed QA has proven one thing: the people in it were probably real. Whether the answer is right is a separate question.
Survey fraud is the loud problem. Kantar reported in 2024 that clients were throwing out as much as 40% of data after fieldwork, and that rejection rates had climbed by roughly 300% across three years. Bell & Holmes built Survey Intelligence against that baseline.
Its illustrative quality funnel assumes an initial ceiling of up to 40% unusable responses. Automated screening removes the bulk of those records; human review then aims to leave fewer than 1% of unusable responses in the released dataset. In the illustrative 450-response study, 412 verified responses were released—an 8.4% total removal rate across the full process.
Fraud filtering, though, solves only half of the problem. Once the bots, the duplicates and the speeders are stripped out, six biases can still sit inside the dataset, and not one of them trips a fraud check. If you have ever stood in front of an investment committee defending a survey-backed market share figure, these six are the ones worth losing sleep over.

What Is Survey Bias?
Survey bias is systematic error: a defect in who got asked, who chose to respond, or how the question was phrased, which drags results away from the true population value in one predictable direction. Random noise fades as a sample grows. Bias does not. Two thousand biased responses simply hand you a tighter confidence interval around the wrong number.
That is why survey bias in market research is so often missed. Kantar's survey design training describes it as "the systematic deviation of survey results from the true population parameters", introduced during design, implementation or analysis.
Fraud screening works on implementation. Most biased survey results get their start in the design and their finishing touch in the analysis.
What Survey QA Catches, and What It Cannot
Survey QA removes respondents who have no business being in the data. It cannot remove genuine, qualified respondents who were recruited off the wrong list, were handed a loaded question, or never replied at all - their records sail through every check.
The fraud side is measurable. In a February 2022 experiment, Pew Research Center asked opt-in panelists whether they were licensed to operate a class SSGN nuclear submarine. Among adults under 30, 12% said yes; the true share rounds to zero. (For how fraud gets past standard checks, see When Surveys Lie.)
Survey Intelligence is built for exactly this. In the illustrative 450-response study on the Survey Intelligence page, vetted sourcing, identity and IP checks, voice detection and voiceprint analysis remove the bulk, a person reviews every interview, and 412 verified responses are released out of 450.
Those 412 people are real. Whether they add up to the right answer is a different test. A CASE4Quality study reported by Greenbook found 3% of devices accounted for 19% of all survey completions, and 40% of those devices completed more than 100 surveys a day "while passing all quality checks." The same article links frequent survey-taking to lower brand awareness, higher brand ratings and higher purchase intent.
Standard checks cannot see that pattern, because every single completion looks acceptable on its own. That is why Survey Intelligence layers a hashed, survey-scoped fingerprint and voiceprint analysis on top of its identity and IP checks, and why a human reads every answer. A panel veteran who glides through the ratings still has to talk through the key scores out loud.
Not all of the damage is fraud, though. Some of it is bias - six kinds of it that no fraud filter was ever built to catch.
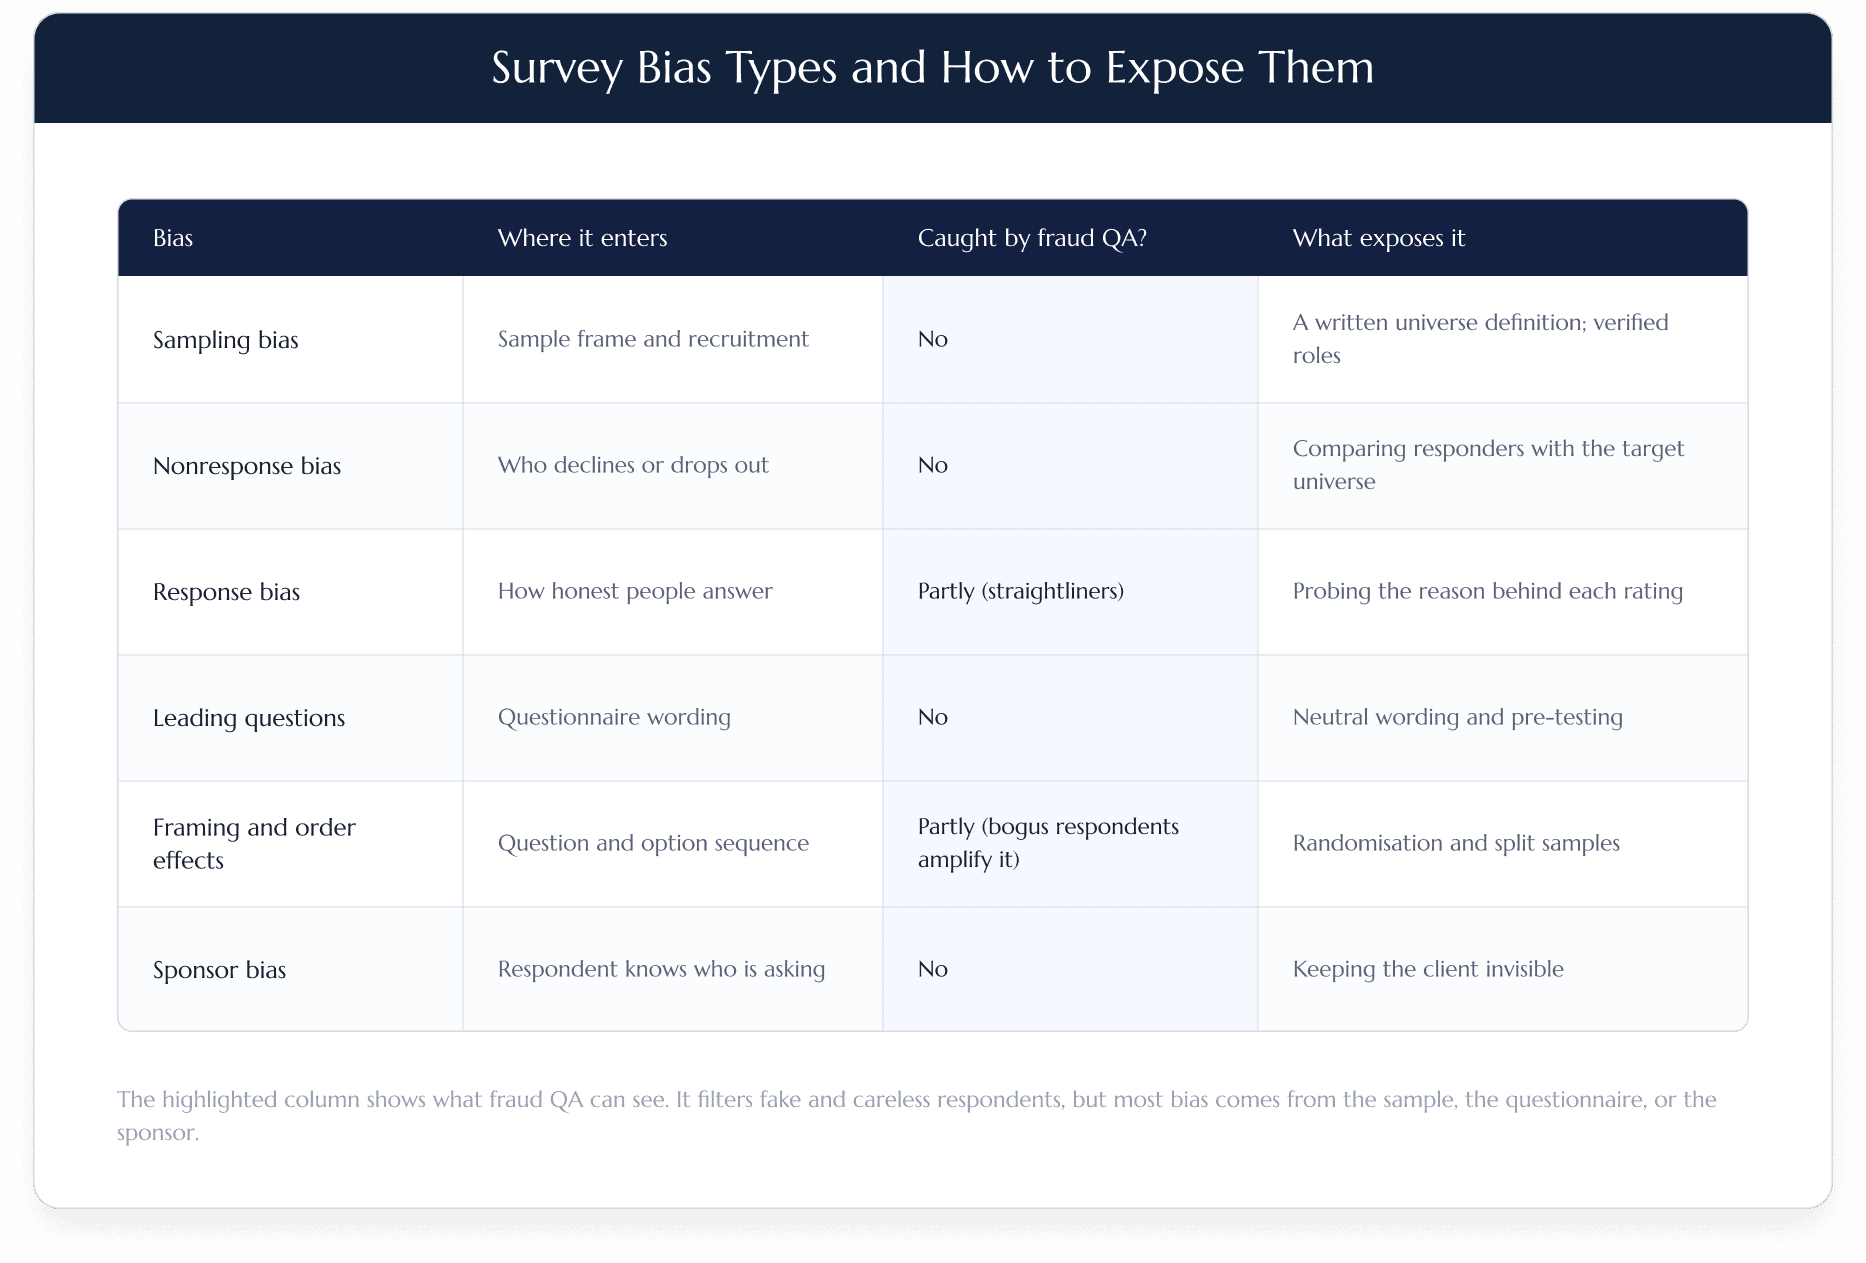
The Six Types of Survey Bias That Survive QA
The six types of survey bias that survive QA are sampling bias, nonresponse bias, response bias, leading questions, framing and order effects, and sponsor bias. The first two decide who is in your data. The other four decide what those people tell you. Leading questions and framing are often grouped as questionnaire bias, since both are built into the instrument before fieldwork starts.
1. Sampling bias: good checks on the wrong universe
Sampling bias happens when the list you pull from does not match the population you intend to describe. In 1936 the Literary Digest mailed roughly 10 million straw ballots, drawn mostly from car registration lists and telephone directories, got back about 2.4 million, and forecast that Alf Landon would beat Franklin Roosevelt. Roosevelt carried the election in a landslide.
Peverill Squire's 1988 analysis in Public Opinion Quarterly found that both the skewed list and the pattern of who returned ballots drove the miss. Every ballot was genuine. Undercoverage, survivorship (surveying only current customers) and self-selection are versions of the same failure.
2. Nonresponse bias: the people who never answered
Nonresponse bias appears when the people who decline differ systematically from those who take part. After the 2016 US election, the American Association for Public Opinion Research found that many state polls "did not adjust their weights to correct for the over-representation of college graduates," a group more likely to answer surveys.
Low response rates do not automatically create non-response bias. The risk arises when the people who do not respond are systematically different from the people who do. Pew Research Center has documented the long decline in telephone survey response rates, but a low response rate alone does not tell you the direction or size of the resulting error. The practical question is not simply how many people answered; it is whether the respondents still resemble the population the study claims to describe.
3. Response bias: honest people, skewed answers
Response bias is a genuine respondent answering inaccurately in a predictable direction. Acquiescence is the pull toward agreeing with a statement, and Pew notes it is stronger among less educated and less informed respondents and "even more pronounced when there's an interviewer present."
Social desirability nudges people towards whichever answer casts them as competent. Some respondents camp on the ends of a rating scale; others cluster in the middle.
A procurement director who scores a supplier 8 out of 10 to avoid sounding harsh will clear every QA check in existence. Voice does not eliminate that pressure; in some contexts, speaking an answer can increase it. Its value is that the rating arrives with a reason that can be reviewed: an 8 out of 10 backed by a concrete switching story means something different from an 8 backed only by polite generalities. As the Survey Intelligence page puts it, closed-ended surveys show you the what, rarely the why.
4. Leading questions and loaded wording
A leading question signals the answer it expects. "How much time does the platform save your team?" assumes it saves time. A neutral version asks, "How has the platform changed the time your team spends on reporting, if at all?"
In B2B studies the loaded word is often the client's own category jargon, which respondents repeat because it sounds like the expected vocabulary. Open, well-sequenced questions help here; our sample open-ended questions for CDD show the pattern.
5. Framing and order effects
Framing effects occur when logically identical options produce different choices depending on how they are described. In Amos Tversky and Daniel Kahneman's 1981 study in Science, 72% of participants chose a certain option when outcomes were described as lives saved; described as deaths, 78% picked the risky alternative.
Order effects work the same way through sequence, and they compound with fraud. In August 2026, Pew found an average primacy effect of 7 percentage points across 13 randomised questions before any screening. Trap questions cut it by 4 points: smaller, still there.
6. Sponsor bias: when respondents know who is asking
Sponsor bias is resolved at scoping. Respondents should not be told the commissioning client where that knowledge could influence their answers, and the study introduction should describe the research neutrally. Anonymity is not a cure-all: customers may still infer the sponsor from the category, question wording or outreach route. But keeping the client invisible removes the most direct reason to flatter, defend or criticize a known party.
Bell & Holmes addresses this at design stage by keeping the commissioning client invisible where appropriate, so respondents have less reason to flatter, defend or criticize a known party. Public data quantifying sponsor effects in B2B surveys is thin, so be wary of any single figure you see quoted for it.
How Bias Undermines Reliability in Market Research
Most causes of bias in survey-based market research fall across three stages: design, execution and analysis. Design fixes the universe and the wording, so sampling bias, leading questions and framing are typically locked in before the first invitation goes out.
Execution decides who actually responds. Convenience fills to make quota, reliance on a single panel and fieldwork shut early all lean on the sample. Analysis decides what gets reported: unweighted totals, or only the cuts that flatter.
Survey methodology is mostly won or lost at design. That is also why secondary data built on someone else's survey inherits its flaws where you cannot see them.
A biased survey is usually very reliable. Repeat it with the same frame and wording and you get the same wrong answer, so repeatability says little about accuracy.
How can bias affect the outcome of a survey in a live deal? It pushes numbers in one direction. Share looks higher because loyal customers were the easiest people to reach. Churn intent looks lower when ticking a box is all a respondent has to do, with no explanation required. Price tolerance follows whichever frame the question happened to use.
Professional pollsters are not immune. AAPOR's 2020 task force found pre-election polling error was the highest in 40 years for the national popular vote. For the deal-side version, see red flags that only primary research surfaces.
How Do I Reduce Bias in Survey Research?
You reduce bias in survey research by fixing the design before fieldwork and testing the data after it. No single control covers all six types.
Design neutral questions. Swap agree/disagree statements for a forced choice between alternatives, as Pew recommends, and cut the adjectives that smuggle in a verdict. Pre-test on a handful of real respondents.
Define and diversify the sample. Write down the universe (role, company size, geography, buying authority) before picking a panel, and set quotas so no segment dominates by accident.
Randomise where you can. Random selection is the textbook fix for sampling bias; rotating option order controls primacy.
The honest limit: in B2B, true random sampling is almost never on offer, so the workable substitute is a tightly defined universe plus evidence that each respondent sits inside it.
Five questions to ask before a survey number goes in the deck
Most deal teams receive a survey rather than design it. CASE4Quality's advice to research buyers is to demand sources, fraud rejection rates and reasons for terminations for every study. Turned into a diligence checklist, that becomes five questions:
- Which sample sources were used, and how were they vetted?
- How many responses were removed, at which stage, and why?
- How was the target population defined before fieldwork?
- Can we see respondent-level raw data, not only weighted charts?
- Did respondents know, or could they guess, who commissioned the study?
Survey Intelligence is set up to answer the first four as standard: vetted panel sources, stage-by-stage removal with a human decision on every flag, a population agreed on the scoping call, and raw plus tabulated data at respondent level. The fifth is a design choice worth settling at scoping on any provider's study, ours included.
Does Sampling Bias Affect B2B Surveys?
Yes, and usually more than in consumer research. B2B universes are small, contact lists are incomplete, and a narrow professional audience can be thin on any panel. A title is not buying authority either: a "VP Operations" at a 12-person firm and one running a Fortune 500 plant count the same in a crosstab.
Panel size claims deserve scrutiny too. The same CASE4Quality article observes that while panels may advertise millions of members, “only 5-10% are typically active.” For a niche B2B audience, the usable pool can be a fraction of the brochure figure.
Small universes magnify every error. In a 150-respondent study, ten people who should not be there move a headline metric far more than they would among 2,000 consumers.
Often there is no usable frame at all. On a Big 3 commercial due diligence project covering US trucking owner-operators, the client's initial list proved unworkable; Bell & Holmes sourced respondents independently and completed 105 interviews in 7 working days. On another, covering veterinary services for North American cattle operations, the client could not provide a functional list, and the team delivered 31 in-depth interviews with qualified decision-makers in 5 working days.
The practical rule: survey scale fits large audiences such as customers, users and consumers, where panels are deep and a voice-probed survey can reach hundreds in days. Small professional universes need direct interviews alongside the survey, not instead of it.

How Survey Intelligence Is Built Around These Biases
Survey Intelligence combines the depth of an interview with the scale of a survey, verified by humans. Fraud removal is its first layer; most of the stages after it map to a bias from the list above.
Sampling. Sampling bias is settled before fieldwork, so the population, the questions and the scope are agreed on a 15-minute scoping call. Vetted sourcing, identity and IP checks, voice detection and voiceprint analysis then confirm that every respondent is a real, unique person who fits that definition.
Verification answers who answered. The scoping call answers whether they are the right population. The study needs both.
Response bias. Respondents answer the open questions by voice, and the engine probes each answer in real time "for specificity and rationale." The ratings that drive the decision arrive with the reasoning behind them. An 8 out of 10 with a vague reason reads very differently from one backed by a concrete switching story. In the page's illustrative 412-response study, an NPS of +48 arrives with its drivers already coded from voice answers: ease of onboarding 42%, pricing and value 27%, support responsiveness 19%, product breadth 12%.
Leading questions. The Bell & Holmes team scripts and QA's the questionnaire with the client. AI follow-ups are "driven by the brief we align on with you, not random prompts," which keeps loaded wording out of the probes as well as the script.
Analysis and reporting controls. A person reviews every interview. A system flag "is a warning for the project manager, never an automatic rejection," and output is human-verified before release, never a raw AI export. Case teams get respondent-level data, raw and tabulated crosstabs and a synthesis memo, so weighted and unweighted cuts can be checked, not taken on trust. Analysts also flag anomalies, spell out the commercial implication and name the next question worth testing.
Speed. The survey goes live within 24 hours of go-ahead, collects 100+ responses a day and delivers a topline in days, which fits a deal window.
No survey method removes nonresponse bias entirely, and Survey Intelligence does not claim to. Everyone who ignores the invitation is still missing, which is why the case team sees removal counts and respondent-level data rather than a finished number alone. When the missing group is a small professional universe - the owner-operators and cattle operations above - Bell & Holmes runs Direct Interviews alongside the survey: trained research consultants sourcing respondents one by one across 140+ countries and 35+ languages. Both sit under what the service page calls "one operating standard across all levels of depth, and no vendor change when the question gets harder."

When Clean Data Is Still Wrong
A fraud-free dataset gets a survey into the room. What keeps its number upright in front of an investment committee is knowing which of the six biases were designed out, which were tested for and which are still there. The gap between winning a deal and walking away often comes down to a single figure nobody thought to question.
Next step: send Bell & Holmes your scope, timeline and target profile. Feasibility and a ramp-up plan are typically confirmed within the hour. Not ready for a scoping call yet? See how the verified-human quality system works on live CDD projects.
Our services
From hypothesis to investment-ready evidence

One operating standard across all levels of depth, and no vendor change when the question gets harder
Where we operate
Traditional Surveys
Survey Intelligence
How it works →Direct Interviews
See the process →Expert Network
Not sure which approach your project needs? We will point you to the ideal one that still answers it.