09/10/2026
Qualitative vs Quantitative Research: A Decision Framework for PE and Consulting Teams
Qualitative vs quantitative research for deal teams: a four-question framework for choosing interviews, surveys or both in CDD, with sample-size benchmarks.
"How many interviews do we need?" opens most scoping calls, and the question usually lands before anyone has said which decision the research has to defend. That order produces the wrong research design more often than people admit.
If you have ever signed a diligence engagement on a Friday with an investment committee ten days out, you know there is no slack to run the wrong method first and correct it later. This article gives deal and case teams a working answer to the qualitative vs quantitative research question: what each method can prove, which one a commercial due diligence workstream needs, and how many interviews or responses it takes before the answer holds up.
What Is the Difference Between Qualitative and Quantitative Research?
Qualitative research explains why and how. It collects words through interviews, focus groups and observation to explore a problem and generate hypotheses, so it is exploratory by design. Quantitative research measures how many and how often, collecting numbers through surveys and experiments to test those hypotheses across a sample, which makes it confirmatory.
In due diligence, qualitative explains the market and quantitative sizes it.
What separates the two is less the data format than what the output lets you claim. An interview programme can tell you that mid-sized logistics operators are switching away from an incumbent because of integration costs, but not what share of the market will follow.
A survey can put a number on that share. Unless someone already knew to ask about integration, though, the survey will never surface integration costs as the reason.
For most of research history, a survey sat firmly on the quantitative side of that line, and it still does unless the instrument is built to capture reasons. Optional text boxes rarely did that in B2B, because busy respondents skip them or type a few words. Voice answers changed the picture: when respondents speak their reasoning and the system asks a follow-up question in real time, each rating arrives with its explanation, at survey scale. That is the approach behind Bell & Holmes Survey Intelligence.
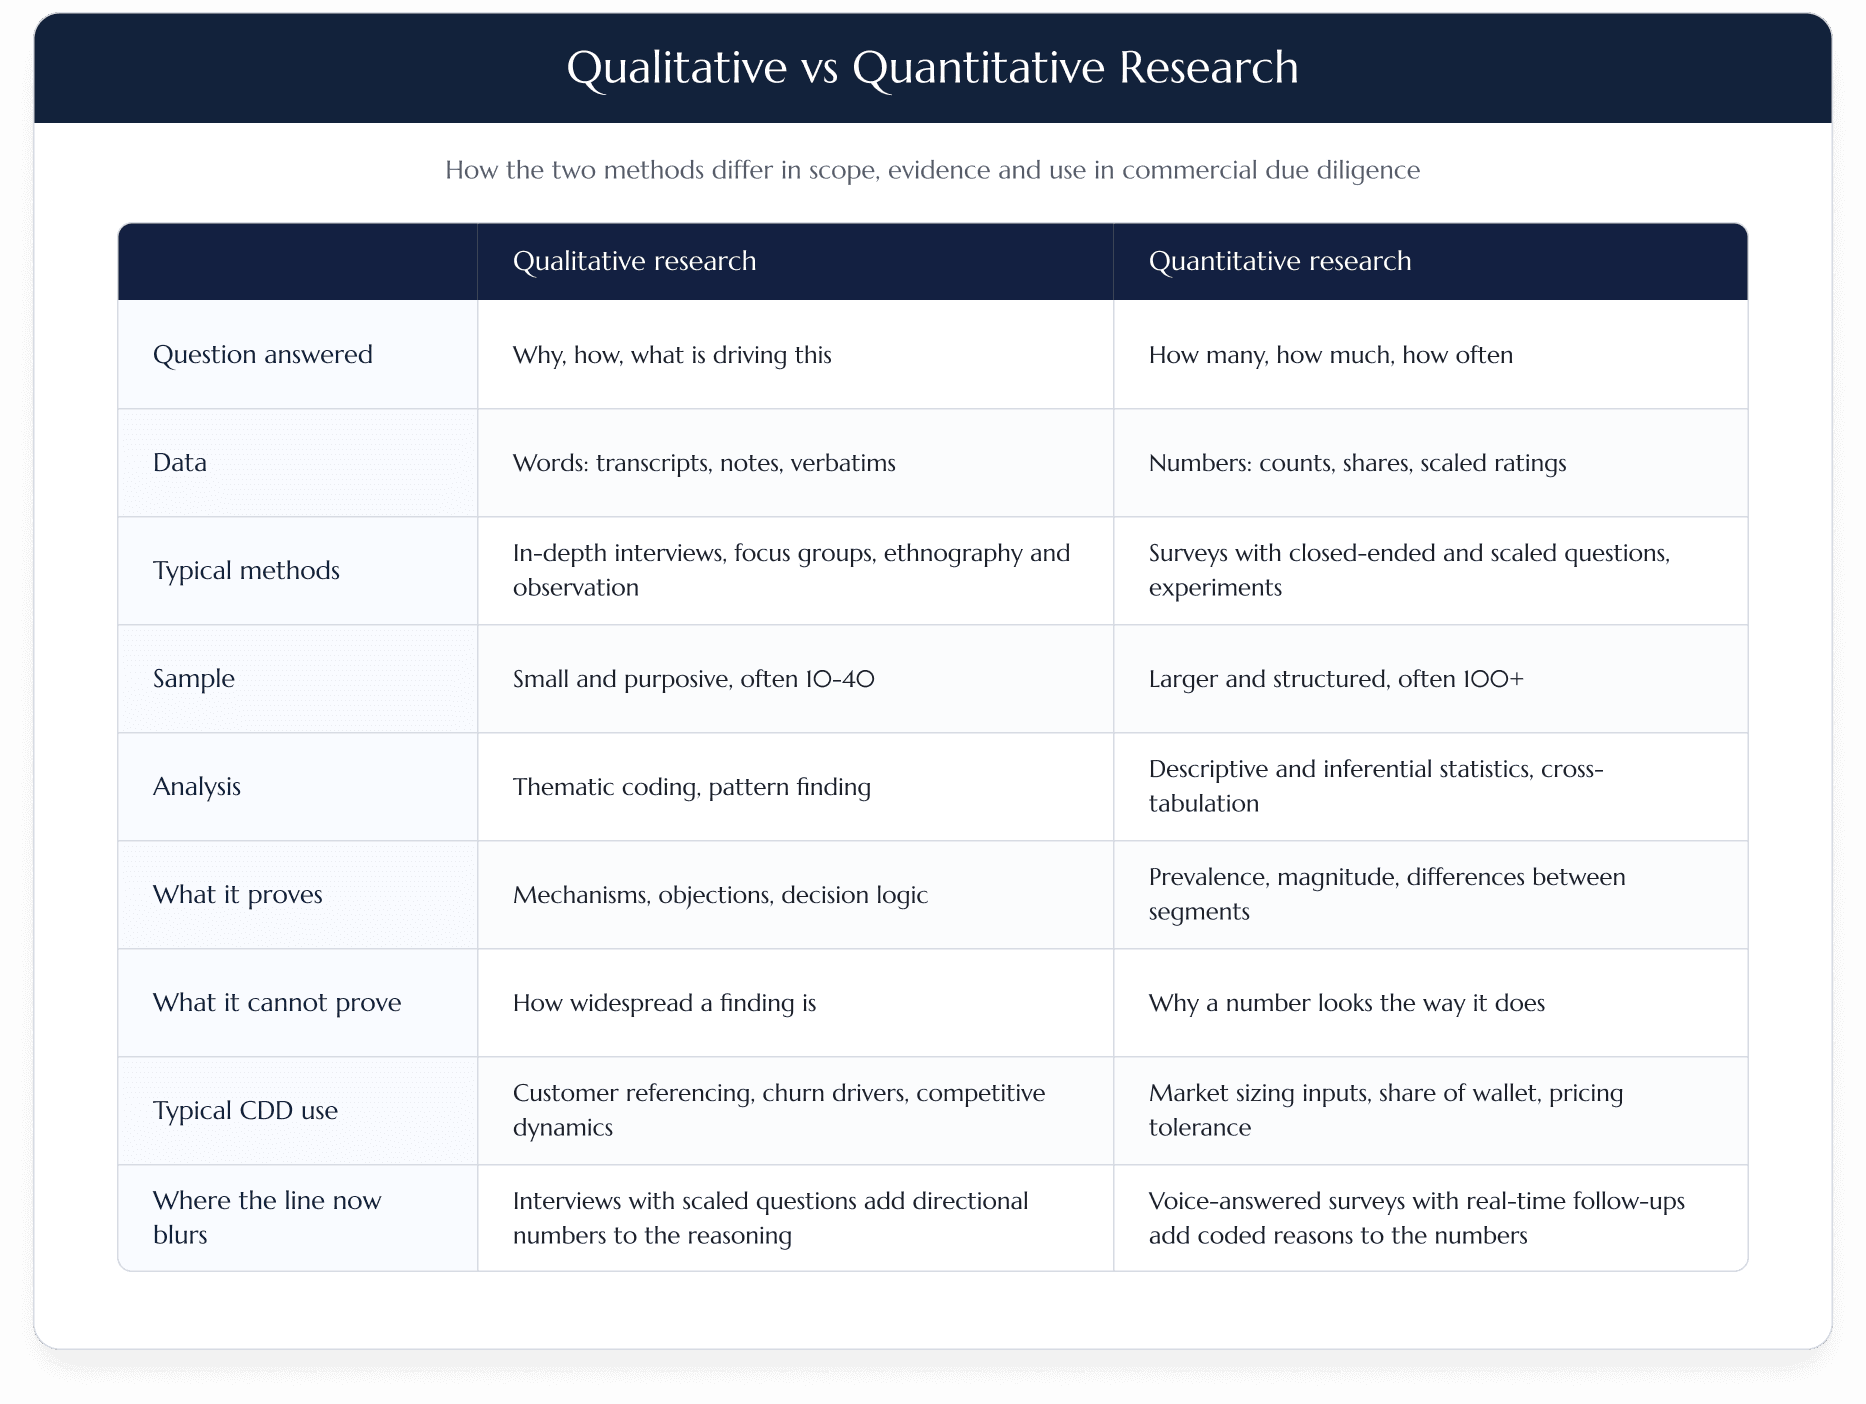
Generalizability is the dividing line. A quantitative result from a properly drawn sample projects onto the population it represents. Qualitative findings project through logic and replication instead: when the same reason surfaces independently across customers, channel partners and former users, the finding is defensible even though it carries no percentage.
Why the Textbook Comparison Breaks Down in B2B Deal Work
Most guides to qualitative vs quantitative research assume a large, reachable population and random sampling. B2B diligence rarely offers either. Target markets are often a few hundred qualifying companies, decisions sit with buying groups instead of individuals, and panels cover senior specialist roles thinly.
Three facts change the maths. First, the size of the universe. A specialist software market might contain 400 credible buyers worldwide, and a survey that reaches 60 of them has covered 15% of the market, which no consumer study ever does.
Second, who decides. According to Gartner, a typical buying group for a complex B2B solution involves six to ten decision-makers. One respondent per company gives you one view of a decision made by several people with different veto points.
Third, access. A mid-market asset manager's compliance head does not sit on a consumer panel, and that is the person whose answer moves the deal thesis.
None of this makes surveys wrong for B2B. What it breaks is the textbook default of "qual for small samples, quant for big ones", a starting point that fails when the whole population is small.
When Should You Use Qualitative Instead of Quantitative Research?
Use qualitative research when you do not yet know the answer options, when the decision depends on a mechanism rather than a magnitude, or when the reachable universe is too small to survey at a useful margin of error. Use quantitative research when the number itself has to be defensible across segments. Four questions settle most scopes.
- Do you already know the possible answers? Closed-ended questions only work when the list of answers is known and complete. If you are asking why customers churn and cannot yet name the top five reasons with confidence, a survey will measure your assumptions rather than the market. Run interviews first, or at least run a short open-ended question set before you fix the survey instrument.
- Is the decision about a mechanism or a magnitude? "Why are distributors favouring the competitor's product line?" is a mechanism question. "What share of distributors stock both lines?" is a magnitude question. Mechanism questions need conversation and follow-up probes, the ground covered in our piece on B2B qualitative research for irreversible decisions. Magnitude questions need a structured instrument and enough responses per segment.
- How large and reachable is the universe? If 200 companies qualify and you can realistically reach 40 of them, the margin of error on any percentage will be wide (see the sample-size section below). Thirty well-chosen interviews may be the more honest evidence base. If 20,000 companies qualify, a survey becomes efficient and interviews become a sampling exercise.
- What will the investment committee challenge: the number or the reason? Ask the deal partner, or picture the IC memo. If the debate will be "is the market really growing at 8%?", you need quantitative evidence. If it will be "why would customers stay after the price rise?", you need verbatim reasoning from current customers.
Often it will be both. In that case a survey that records the spoken reason behind each answer can carry part of the qualitative load, and interviews can be kept for the questions that need a researcher to follow the thread.
Read your four answers together and the design usually picks itself:
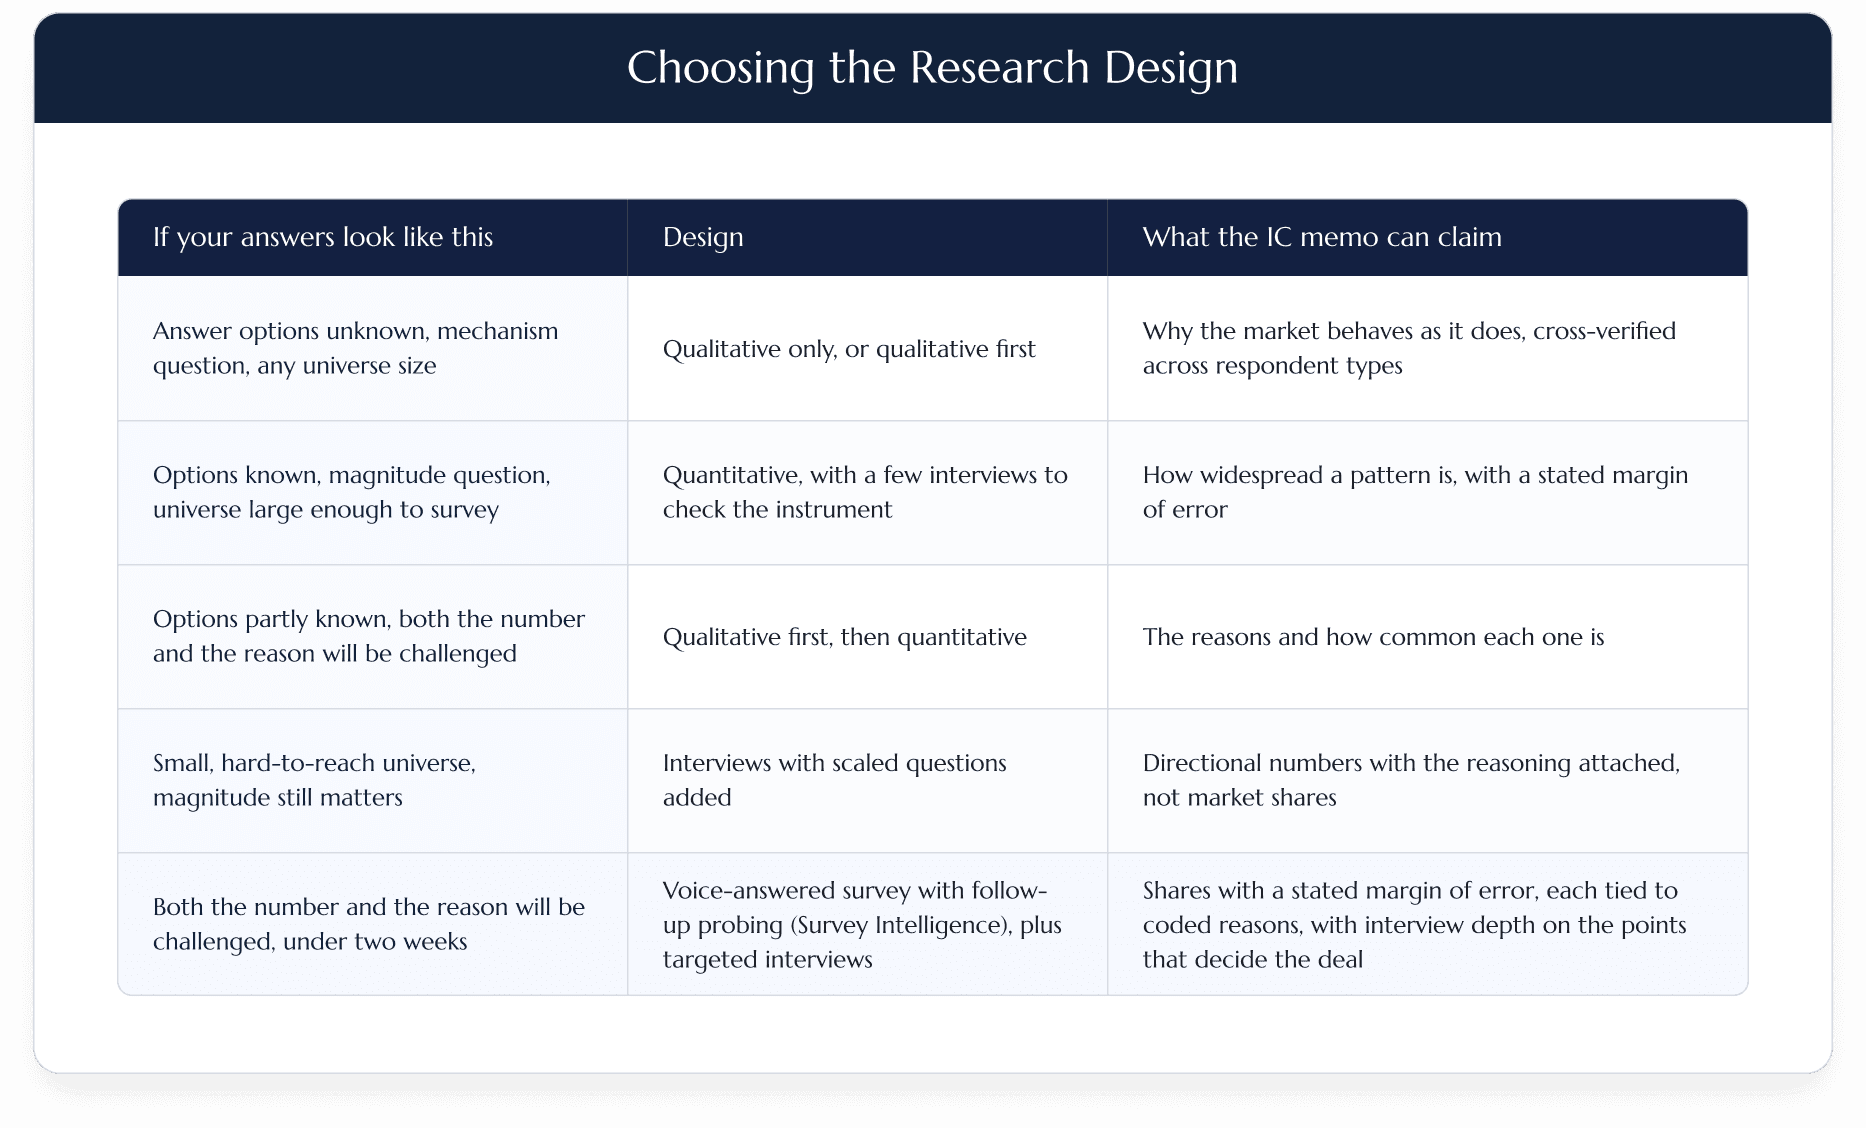
Timeline is the tie-breaker. As a working guide from our own projects, a conducted interview programme produces first results within 48 hours and then 5 to 50 interviews a day. A screened B2B survey typically reaches a three-digit sample within a project week. Both depend on how hard the target profile is to reach.
On the survey side, Survey Intelligence typically goes live within 24 hours of go-ahead, collects 100+ responses a day across 10+ languages and delivers a topline in days, again depending on how reachable the respondents are.
On a two-week CDD, that rarely leaves room to run the two in sequence, so the design shifts to running both in parallel, a pattern covered in how to run primary research under compressed PE timelines.
Which Is Better for Commercial Due Diligence?
Neither method is better for commercial due diligence by default. A typical CDD contains several workstreams, and each leans on a different method, so the right call is made per workstream, not per project.
Market sizing and pricing usually need quantitative input. Customer referencing, competitive positioning and churn drivers need qualitative depth.
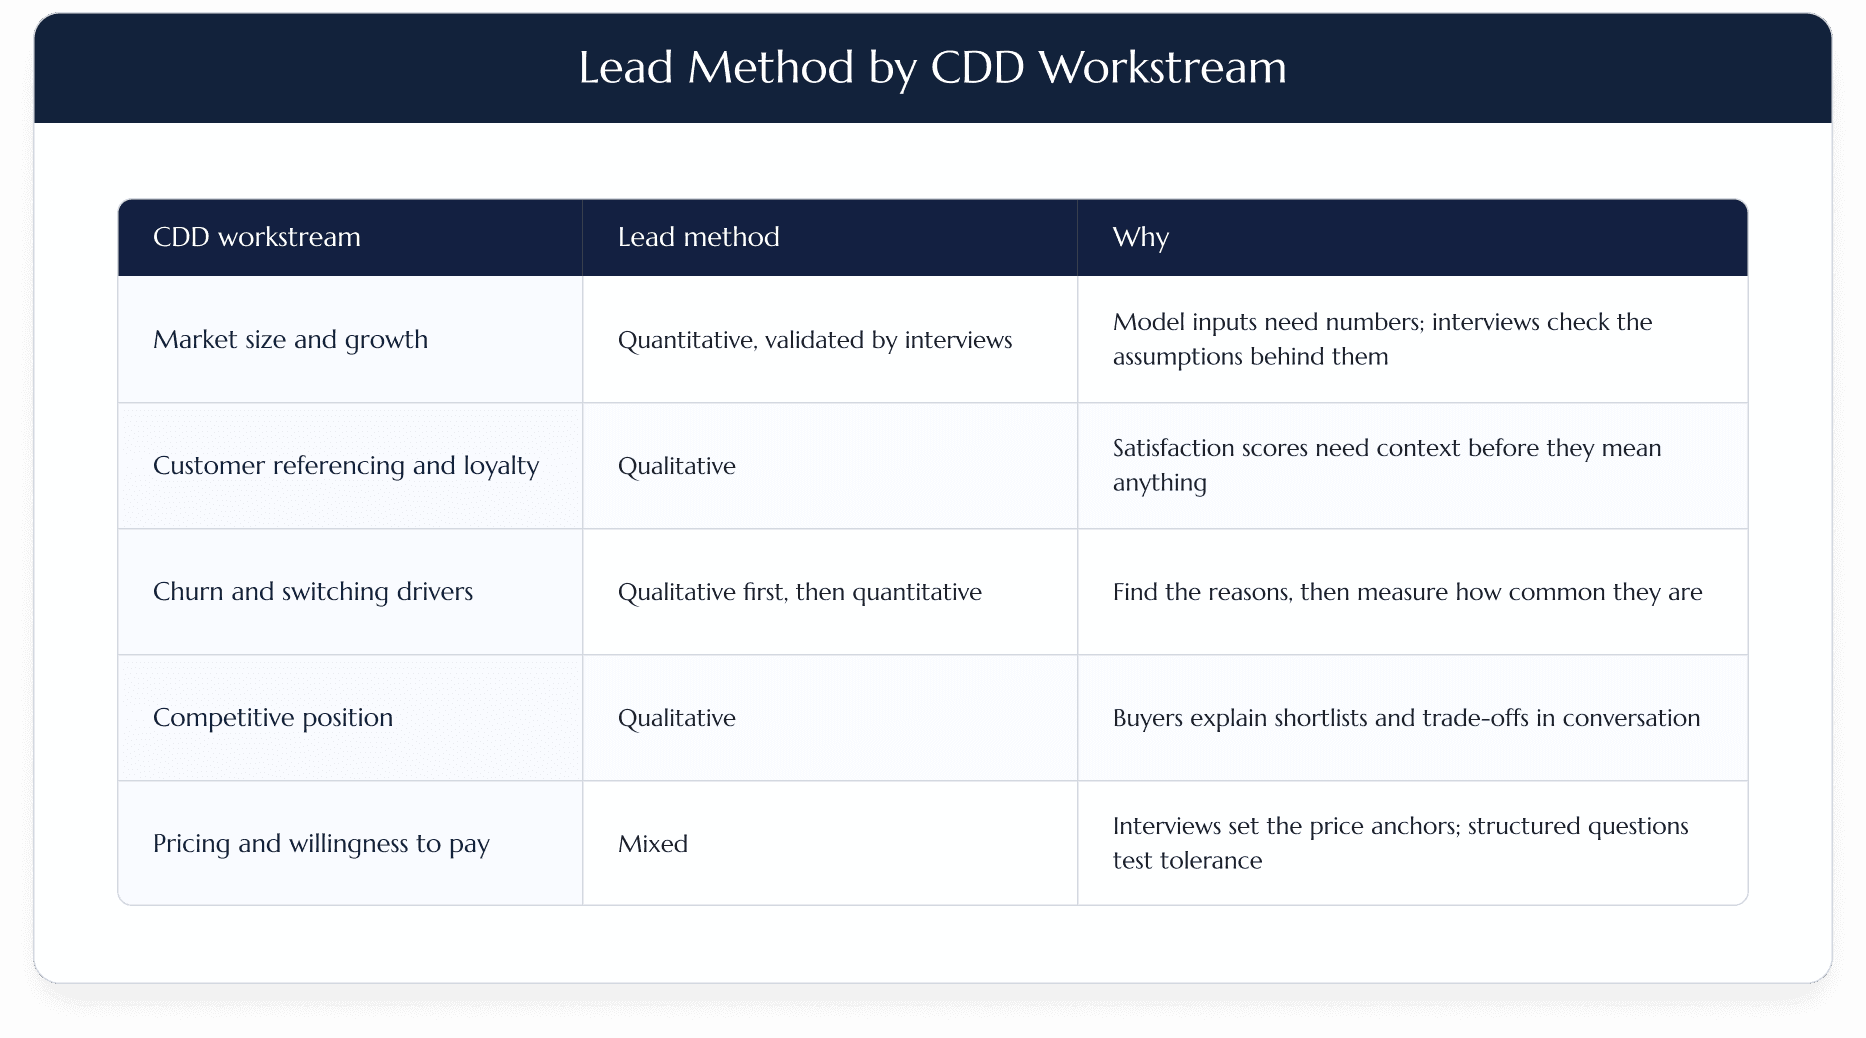
Loyalty is the row where deals most often go wrong. We have seen satisfaction scores that looked acceptable on paper turn out to reflect low expectations instead of genuine loyalty, and that only became visible once customers explained their scores in conversation. A quantitative score without the qualitative read can carry a thesis straight into a problem.
For the full workstream picture, see our primary research for commercial due diligence page, and for the sizing side, our market assessment framework for deal teams.
Qualitative vs Quantitative Sample Size: How Many Interviews or Responses Are Enough?
For a homogeneous respondent group and a narrow question, published studies put qualitative saturation at roughly 9 to 17 interviews. A survey needs about 384 responses for a ±5-point margin of error in a large population, and fewer in a small finite one. In both cases, count per segment, not in total.
The qualitative benchmarks come from health and social research. Guest, Bunce and Johnson (2006) found thematic saturation within 12 interviews in a homogeneous sample.
Hennink, Kaiser and Marconi (2017) separated two thresholds: code saturation (you have heard every theme) at around 9 interviews, and meaning saturation (you understand each theme) at 16 to 24. A systematic review by Hennink and Kaiser (2022) of 23 empirical studies landed at 9 to 17 interviews. Where samples crossed sites or cultures, Hagaman and Wutich (2017) needed 20 to 40.
That last figure matters for multi-country diligence. Twenty interviews spread across five countries and three customer types is not twenty interviews. It is barely more than one per cell.
The quantitative side is arithmetic. The figures below are our own calculation at 95% confidence, assuming the answer could split evenly:
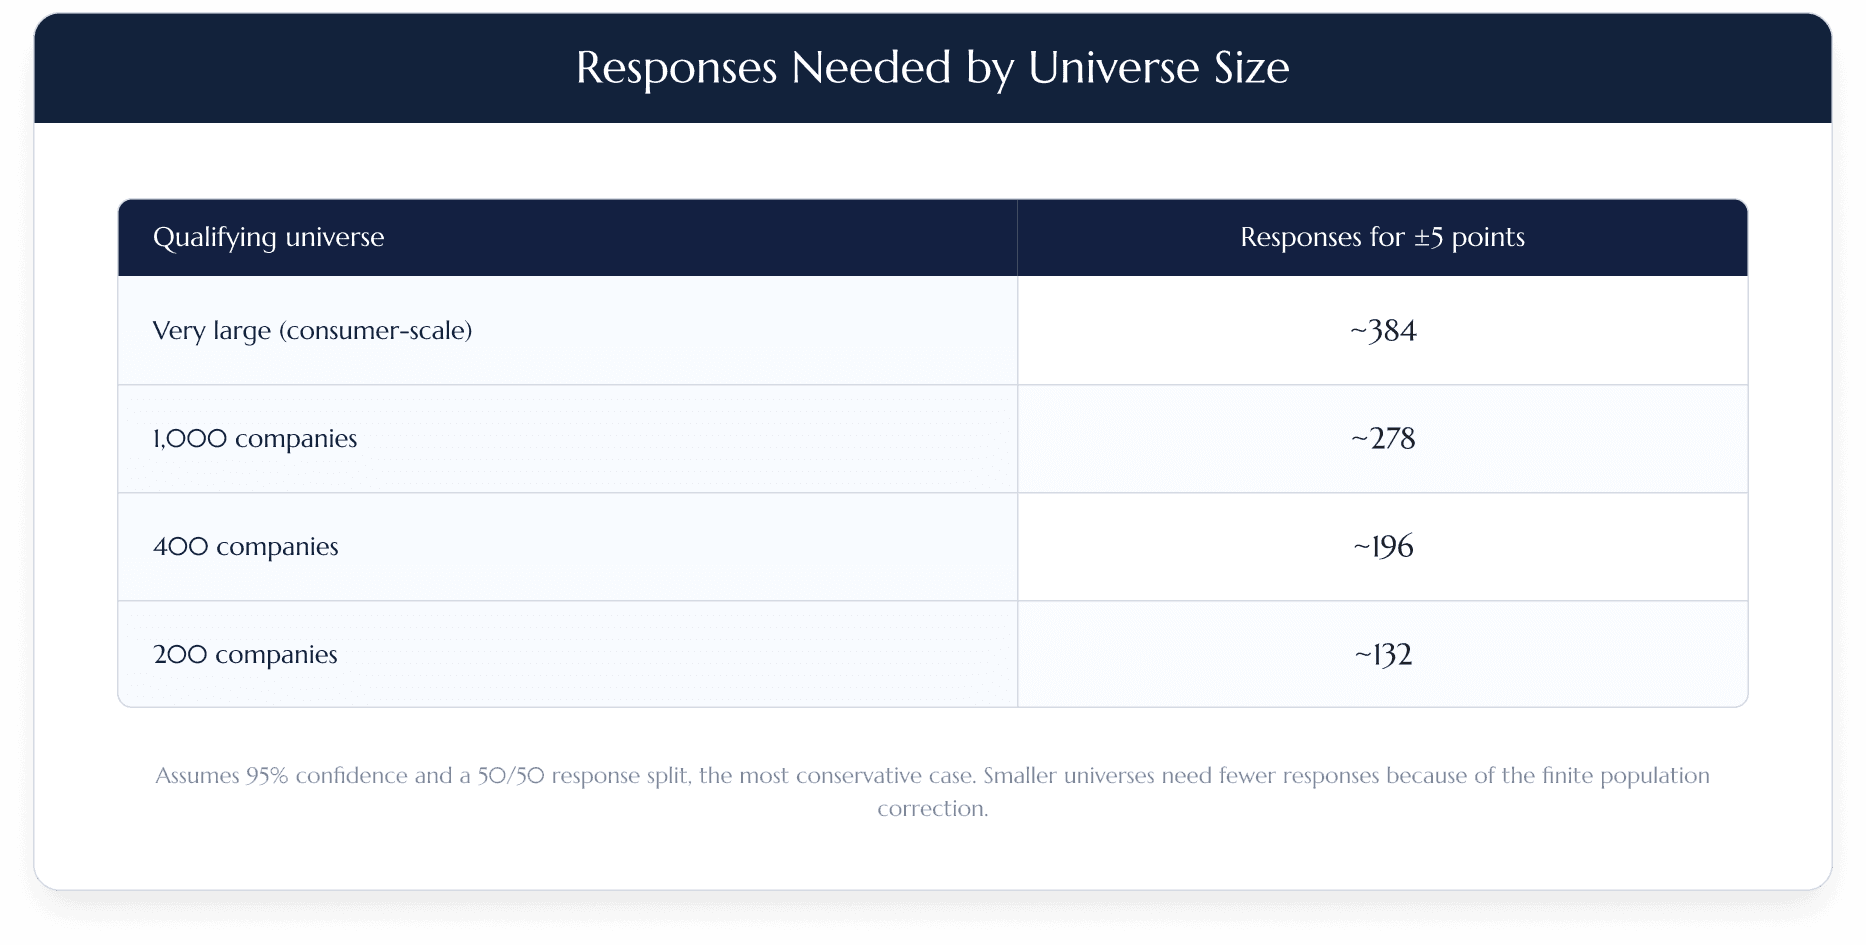
Read in reverse, 100 responses from a large population give a margin of roughly ±10 points. In the 200-company case above, 40 responses give roughly ±14. That is fine for spotting a dominant preference and too loose for a share estimate in an IC memo.
The practical stopping rule for interviews is simple: stop when new conversations confirm the picture rather than change it. Reviewing results daily makes that point visible in real time, so a team can redirect the remaining interviews to the segment where evidence is still thin.
Can You Combine Qualitative and Quantitative Research in Due Diligence?
Yes, and most decision-grade CDD does. Combining qualitative and quantitative research, usually called mixed methods research, follows one of three sequences: explore then measure, measure then explain, or run both in parallel. All three sequences aim at triangulation, where the same conclusion is reached through different evidence.
Explore then measure is the classic order. Interviews identify the real switching reasons; a survey then measures how widespread each one is. Measure then explain runs the other way: a survey shows one segment rating the target far lower than the rest, and interviews in that segment find out why.
Parallel designs suit compressed timelines. Interviews and a short structured instrument run in the same week, with the first 15 to 20 survey completes treated as a pilot. Adjust the instrument once against early interview themes, then lock it. Anything new after that goes to follow-up interviews or a second wave, which keeps every respondent on the same questionnaire.
Expert calls fit at the front of this sequence: senior specialists help frame hypotheses while the team is still working out what to ask, and conducted interviews and surveys then put those hypotheses to the test with current market participants.
Turning interview counts into market shares is the common failure. "Fourteen of twenty customers would consider switching" is a strong signal, and any IC member who has read a few CDD reports will push back if it appears on a slide as a 70% churn risk.
Adding scaled questions to every interview helps, because it gives a directional number with the reasoning attached. Twenty conversations still do not make a representative sample.
The reverse route is newer. Voice open-ends with real-time follow-up questions give a survey some of the explanatory power of an interview, at survey scale. Coded reasons from 300 respondents still fall short of 30 in-depth interviews: the follow-ups are narrower, steered by the brief, and nobody is reading the room. What they do show is how common each reason is, the question that used to need a second wave of fieldwork.
How the two strands connect is set out on our primary research methods for consulting and investment decisions page.

Where Each Method Fails
Qualitative research fails through selection and interpretation: articulate respondents get over-weighted, one memorable quote gets read as a trend, and two analysts can code the same transcripts differently. Quantitative research fails through context and data quality: numbers arrive without reasons, a lack of context no sample size fixes, and some of the responses may not be genuine.
On the quantitative side, the data-quality problem is measurable. Kantar reported that in Q4 2022 researchers were discarding up to 38% of the data they collected because of quality concerns and panel fraud. In an opt-in poll, Pew Research Center found 12% of adults under 30 claiming to be licensed to operate a class SSGN nuclear submarine. Nonresponse and response bias add a quieter layer on top, covered in our piece on survey bias that survives QA.
That baseline shaped how we built Survey Intelligence. Our service benchmarks put the industry's post-fieldwork rejection rate at up to 40%, citing the Kantar Marketplace Data Quality Report (2024) and GreenBook's GRIT Report (2025). On our own staged figures, automated guardrails (identity and IP checks, voice detection, same-IP duplicate blocking) bring the share of unusable responses under 10%, and a person then reviews every response before release, which takes it under 1%.
On the qualitative side, small samples carry researcher and participant bias that no sample size fixes. Structured discussion guides, two-person review of findings and cross-checking themes across respondent types are the controls.
One honest caveat on the evidence: the saturation studies above draw mostly on health, education and social research. There is no comparable published body of work on samples of B2B executives. The 9-to-17 range is a useful starting point for a homogeneous B2B segment, not a guarantee.

How Bell & Holmes Builds the Evidence Mix
On a scoping call we route the brief with two questions. Do you need the reasoning behind the number? Then the core is conducted B2B interviews.
Do you need a defensible number across segments? Then the core is a structured survey.
For that we run Survey Intelligence: screened B2B respondents answer by voice, the system probes each answer for specifics, and an analyst verifies every response before release. The case team receives a verified dataset, crosstabs and a synthesis memo, so the number arrives with its reasons already coded.
Most CDD briefs need both, so we design one evidence mix instead of two separate projects. When interviews and a survey run through two vendors, the deal team usually ends up reconciling two respondent definitions in the final week. In one coordinated programme, both are screened against the same target profile, early interviews shape the survey instrument, and survey patterns tell us where to aim follow-up calls.
Sourcing is where the timelines are won. On a niche compliance software diligence, the target was C-level and compliance executives at hedge funds and asset managers, a group that survey panels rarely cover. Direct outreach delivered 23 in-depth interviews across six countries in five working days.
Verification matters as much as reach. For a European private equity firm assessing an enterprise data platform, there was no usable client list, so every respondent was sourced independently and confirmed as a current user or implementation partner before the call, so every respondent was a verified current market participant. Sixteen interviews were delivered in three working days.
Language is the third lever. Translated interviews lose the detail diligence depends on, so our trained research consultants interview in the respondent's native language, across 140+ countries and 35+ languages. As a hybrid primary research partner, Bell & Holmes typically turns first results around within 48 hours of scope confirmation, depending on how hard the target profile is to reach.

Choose the Evidence Before You Choose the Method
Decide what the investment committee will challenge before you pick the method. Method, sequence and sample size all follow from that answer.
A satisfaction score read without the reasons behind it can carry a thesis into a problem the interviews would have caught, and in diligence that is often the difference between winning a deal and walking away from it. To see how the evidence mix worked under a five-day deadline, read the six-country compliance CDD case study.
If you are scoping a CDD or strategy project and want a second view on the evidence mix, talk to the team.
Our services
From hypothesis to investment-ready evidence

One operating standard across all levels of depth, and no vendor change when the question gets harder
Where we operate
Traditional Surveys
Survey Intelligence
How it works →Direct Interviews
See the process →Expert Network
Not sure which approach your project needs? We will point you to the ideal one that still answers it.